Assigning Variable Roles
- Overview
- Assigning the Time Variable
- Assigning the Dependent Variable
- Assigning the Default Attributes
- Assigning Independent Variables
When you create a project with time seriesan aggregation of transactional data into specified time intervals and sorted according to unique combinations of the default attributes (BY variables) data, the project is opened to the Data tab. In the left pane, the time series data set is selected.
Overview
Use the middle pane to select variables and the right pane to assign roles to a selected variable.
- The time and dependent variables are required and should be assigned before performing any other activities in the project.
- The BY variables are optional but are strongly recommended. These variables are used to set the project up so that you can work with different cross sections of your data based on attribute values that you specify.
- You might want to assign some of your variables as independent. Independent variables can be used to model and forecasta numerical prediction of a future value for a specified time period for each unique combination of BY variable values the dependent variable.
- After making your variable assignments, review the project settings .
- Any variables that are not assigned can be removed from the project. For more information, see Refreshing Project Data.
Assigning the Time Variable
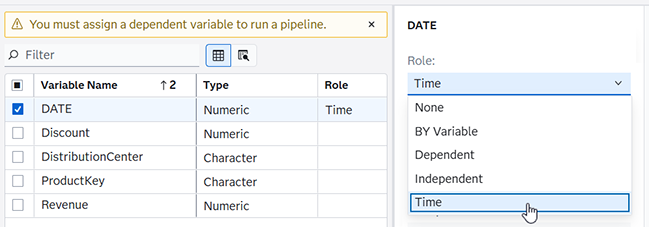
For new projects, if the system detects only a single time variable candidate, then that variable is already assigned. If the system detects multiple time variable candidates, you must choose one of them as the time variable. The variable must be using either a date or datetime format.
- Select the variable in
the middle pane and, in the right pane, select
Time for
Role.
Time Variable Selection in Role Field
The settings for the time variable are displayed on the right.
- Review the time variable settings and make sure they are correct for this project. For a complete description of each field, see Time Variable.
If you need to reassign the time role to another variable, you must first remove the assignment for the current time variable.
Assigning the Dependent Variable
Dependent variables are the variables that you want to model and forecast. You must assign one numeric variable to this role. For example, you want to forecast the sales for each product, you assign the Sales variable to the dependent variable role.
- Select the variable in the middle pane that you want to use to obtain forecasts and, in the right pane, select Dependent for Role.
- Review the dependent variable settings and make sure they are correct for this project. For a complete description of each field, see Dependent Variable.
If you need to reassign the dependent role to another variable, you must first remove the assignment for the current dependent variable.
See Also
Assigning the Default Attributes
BY variables are used to create attributes to uniquely identify each time series. For example, your data source might have variables for Region, Product line, and Product. By assigning these as BY variables, SAS Visual Forecasting collects the dependent variable into individual time series using each unique combination specified by these attributes.
See BY Variables for more information about assigning default attributes.
You can also order your BY variables to create a forecast hierarchy. For more information about hierarchical forecast projects, see Defining the Hierarchy.
When you are certain about which variables you want to use as default attributes, follow these steps.
- Select one or more variables in the middle pane that you want to use as an attribute.
- In the right pane, select BY Variable for Role.
- In the right pane,
examine order of the BY variables under Selected
hierarchy. If you use hierarchical
forecasting in the project, use
 and
and  to arrange selected variables in the best order
for the hierarchy. For more information about hierarchical
forecasts, see Defining the Hierarchy.
to arrange selected variables in the best order
for the hierarchy. For more information about hierarchical
forecasts, see Defining the Hierarchy.
When you have completed the default attributes assignments, select Default attributes in the left pane. The default attributes are listed in the middle pane.
If you import additional attributes to your project, the default attributes are merged with the imported attributes table and the Default attributes selection is removed from the left pane. See Working with Attributes for information about importing attributes.
See Also
Assigning Independent Variables
After you have assigned your time and dependent variables, you might want to assign some independent variables that should be considered for model generation. Independent variables are the explanatory, input, predictor, or causal variables that can be used to model and forecast the dependent variable. You can assign only numeric variables to this role. When creating the system-generated models, SAS Visual Forecasting tries to use the independent variables in the model generation.
Follow these steps to assign independent variables.
- Select the variable in the middle pane that you want to use to obtain forecasts and, in the right pane, select Independent for Role.
- Complete the following
fields:
- Hierarchy aggregation
-
Select from the following values:
- Standard deviation of values
-
Aggregation uses the standard deviation of values for all of the time series in each hierarchy level.
- Minimum of values
-
Aggregation uses the minimum of the values for all of the time series in each hierarchy level.
- Maximum of values
-
Aggregation uses the maximum of the values for all of the time series in each hierarchy level.
- Average
-
Aggregation uses the average of the values for all of the time series in each hierarchy level. For example, select this option if your data set contains the price of each product, and you want to know the average price for a product line.
- Sum of values
-
Aggregation uses the sum of the values for all of the time series in each hierarchy level.
- Number of non-missing values
-
Aggregation uses the number of nonmissing values for all of the time series in each hierarchy level.
- Number of missing values
-
Aggregation uses the number of missing values for all of the time series in each hierarchy level.
- Uncorrected sum of squares
-
Aggregation uses the uncorrected sum of squares for all of the time series in each hierarchy level.
- Corrected sum of squares
-
Aggregation uses the corrected sum of squares for all of the time series in each hierarchy level.
- Time interval accumulation
-
Accumulation combines data within the same time interval into a summary value for that time interval. For a complete description of the accumulation options, see Time Interval Accumulation Settings.
- Missing interpretation
-
Once the data has been accumulated to form a time series, missing value interpretation is performed. If any time series contain missing values for variables other than the time variable (such as the dependent or independent variables), you can specify how SAS Visual Forecasting should to interpret these missing values. For a complete description of these options, see Missing interpretation.
- Usage in system-generated models
-
Select one of the following values:
- Force to use
-
specifies that the independent variable be included in the model as long as the model does not fail to be diagnosed. When you select this option, the delay and polynomial orders for the numerators and denominators of the transfer function are set to zero. If diagnostic analysis associated with the independent variable is unsuccessful, it is impossible to determine the dynamic effects. In this case, straightforward static regression is used.
- Try to use
-
specifies that the independent variable be included in the model as long as its parameters are significant and the increment of the value of Akaike information criterion (AIC) exceeds a threshold. Requiring the information criterion improvement avoids overfitting of the data.
- Use if significant
-
specifies that the independent variable be included in the model as long as the parameters of the independent variable are significant. Dropping the necessity of Akaike information criterion (AIC) improvement risks overfitting.
Note: The usage of independent variables and eventsan incident that disrupts the normal flow of any process that generates the time series. Examples of events are holidays, retail promotions, and natural disasters. in system-generated ARIMA models are automatically set to Force to use if their inclusion does not cause the model to fail.
You can reassign independent variables during the course of a project. However, this can cause failures in any custom models that are created using those independent variables. For more information, see Error Message When Selecting a Time Series from the Modeling Tab of Interactive Modeling .