Selecting Attributes for Filters
Use discretion in the number of attributes to use as filtersa set of specified criteria that are applied to data in order to identify the subset of data for a subsequent operation, such as continued processing. . For performance reasons, it is better not to have more than 20 attributes as filters in a project. When selecting which attributes you want to use as filters, it is helpful to see how attribute values can be specified as filters.
For imported attributes, follow these steps for selecting the best attributes to use as filters by exploring a time seriesan aggregation of transactional data into specified time intervals and sorted according to unique combinations of the default attributes (BY variables) in a pipeline.
- In the Data tab, select the table listed under Attributes in the left pane.
- Select an attribute
in the middle pane and examine these fields in the right pane.
- Activate attribute
-
This setting enables you to use the attributes to create filters. Filters are used to subset the data and create overrides for forecasted values based on the filter settings. Filters can also be used to display filtered views of the historical data in the project. Activate any attributes that you want to use for creating filters.
Activate attribute is available only for imported attributes. All derived attributes are activated.
- Display attribute by default
-
You can work with time series based specific values that you select from attributes in your project. Attributes are listed in a filter pane that is used to select attribute values. By default, all active attributes are displayed in the filter pane. You can choose to hide some attributes by default if you need to reduce the visual clutter of the filter pane. The filter pane enables you to hide or show attributes as you are working with them.
- Display as range
-
Turn on this setting for any numeric filters that have a continuous value. Continuous variables can have a limitless number of values within a range. For example, if you are working with a Weight attribute that could be any decimal range between 20 and 200 pounds, you would turn this setting on.
With this setting turned on, you have these tools to select the lowest and highest values of the range for the filter.
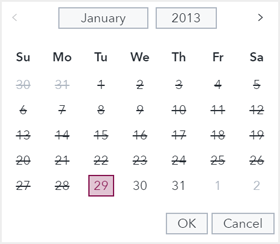
- For numeric attributes
with formatted date or datetime values, you can choose the earliest
and latest date in the valid range using a selector. In this image,
it shows that dates outside of the range cannot be selected:
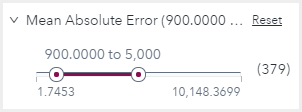
- For all other numeric
attributes with a continuous range, you can click and enter the low
and high values of the range using a slider:
This is explained in more detailed in Creating Filters.
Note: Display as range is enabled only for imported attributes. This setting is fixed for derived attributes and cannot be changed. Derived attributes includeDescriptive statistics,Demand classification attributes, andForecast attributes. - For numeric attributes
with formatted date or datetime values, you can choose the earliest
and latest date in the valid range using a selector. In this image,
it shows that dates outside of the range cannot be selected:
Note: If any filters are created using imported attributes, subsequent changes to Activate attribute and Display as Range can invalidate the filters. For more information, see Disabled Filters. - Select some variables that are good candidates for filtering the project data. In the right pane, select Yes for Activate attribute.
- For any numeric variables with the Activate attribute setting turned on, examine the Display as Range setting and make any necessary changes.
- Select the Pipelines tab.
For new projects, the default pipeline is loaded.
- Right-click the Data node at the top of the pipeline and select Run.
- When the Data node has
finished running, right-click the Data node again and select
Time series viewer.
This opens the plot of the project’s historical data along with a list of attributes that you can use to filter the data in the plot. See Filters for more information .
- Explore different combinations of filter values and observe how the aggregationthe process of combining more than one time series to form a single series
within the same time interval. For example, data can be combined into a total or an
average. plot changes to reflect the data that you have selected.
After you run pipelines on the project and a champion pipeline is selected, you can use any combination of these filter values to specify overrides on forecasta numerical prediction of a future value for a specified time period for each unique combination of BY variable values values. However, after you start working with overrides, your selection of which attributes to use as filters is limited. You can still add attributes to the list of filters, but you cannot remove them.
- Return to the Data tab
and select the attributes table again.
Make any necessary changes to your filter selections. Here are some considerations for setting Display as Range for different data types.
- You cannot use Display as Range for attributes with a character data type.
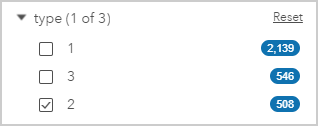
- Attributes with integer values with a very limited
range are not good candidates for Display as Range. The following
example shows a numeric attribute, type, with only
three values. Using a slider to specify a range of values for this attribute is not
useful.
- Attributes with decimal values or a very large integer range are good candidates for Display as Range.
- Use Display as Range for attributes with a SAS date or datetime type.
- Review your settings carefully. After your assignments are locked down, the Activate attribute setting cannot be turned off for an attribute. For more information, see Locking the Data Definition.