Using the Pipelines Tab
- Initial Pipeline for a New Project
- Creating a New Pipeline
- Node Status
- Champion Model Badges on Nodes
- Actions on Nodes in the Pipeline
- Actions on the Pipeline
- Nodes Pane
- Options Pane
Initial Pipeline for a New Project
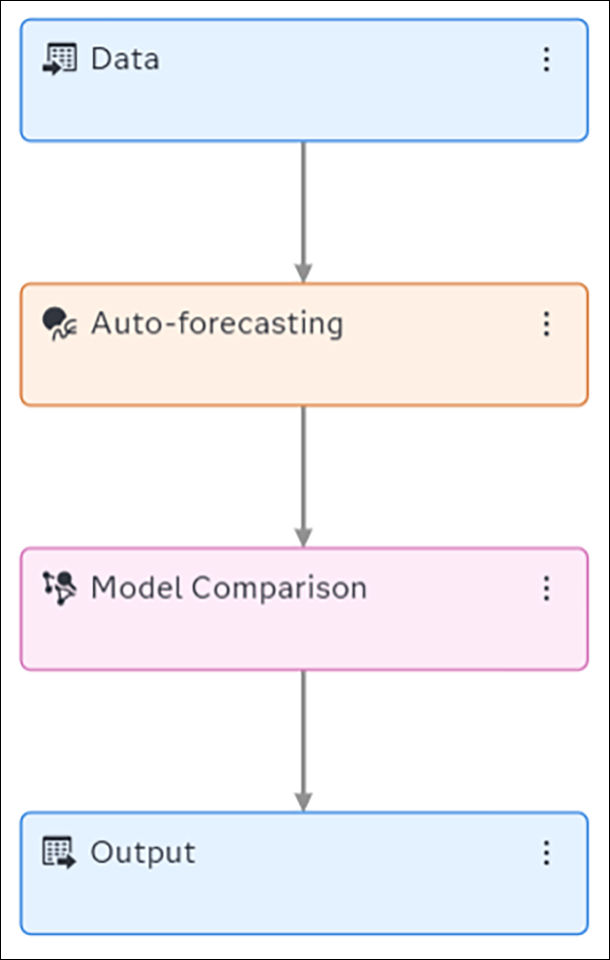
Pipelines consist of
a series of nodes that are run in a sequence to produce forecasts
based on the models and settings that you choose for the project.
After you first create a project, the pipeline is set up in the Pipelines tab.
The pipeline is labeled By default, the initial pipeline for a project uses the template specified when the project was created. You can create new pipelines using different templates and you can make changes to the initial pipeline. |
|
The pipeline cannot be run until you assign the required variable roles as described in Assigning Variable Roles.
See Also
Creating a New Pipeline
- Click
 to create a new pipeline. The New Pipeline window is
displayed.
to create a new pipeline. The New Pipeline window is
displayed. - For Name, change the value to any meaningful string. You can change the pipeline name at any time. After the pipeline is created, you can change the pipeline name by double-clicking the name in the tab.
- Select a template and click Save. See Pipeline Templates Provided by SAS Visual Forecasting for a description of the templates that are available.
- Optional. When the new
pipeline is loaded to the page, you can add a formatted description
to it. Click
 and select Expand header. See Expand header for more information.
 - Optional. You can add multiple modeling nodes to any
pipeline. See Nodes Pane for additional details.
After running the pipeline, you can use the Model Comparison node to determine the best performing node, or champion. The results for each pipeline are derived from the champion modeling node.
See Also
Node Status
As you look at a pipeline, hold your pointer over each node to see its status.
- When you first create
the pipeline, all nodes have a status of
Initialized. - After a node in the
pipeline has successfully finished execution, the node shows a status
of
Successful. - A node with a status
of
Pendingis waiting for other nodes in the pipeline to complete before starting. - When a node starts executing
its functions, its status is
Running. You cannot make any changes to the node until it finishes running. - If a pipeline run fails,
check to see which node has a
Failedstatus. - If you make any changes
to the project settings, variable assignments, or the project training
table the nodes change to
Out-of-datestatus, and the pipeline must be run again. - If a pipeline is stopped during processing, the
status of the subsequent nodes in the pipeline is
Canceled. This can occur for one of the following reasons:- You stop a pipeline before it completes.
- There is a failure in one of the nodes in the pipeline. For example, if the pipeline has only one modeling node and it fails, the subsequent Model Comparison and Output nodes show a status of Canceled.
Champion Model Badges on Nodes
After a pipeline is run, the node that contains
the champion model within the pipeline is indicated by the  icon.
icon.
The node that contains the champion model for the
project is indicated by the  icon. Sometimes this icon does not show when the node image is too small.
In this case, you need to enlarge the pipeline image with the mouse scroll wheel.
icon. Sometimes this icon does not show when the node image is too small.
In this case, you need to enlarge the pipeline image with the mouse scroll wheel.
If you place an Interactive Modeling node after any modeling node in a pipeline, the Interactive Modeling node shows the champion model if either of the following are true:
- There are no models in the Interactive Modeling node that are saved as champion and the predecessor node has better results than the other nodes in the pipeline.
- There are models in the Interactive Modeling node that are saved as champion and the Interactive Modeling node has better results than the nodes in other swim lanes in the pipeline. In this case, the predecessor node will not show the champion icon, even if its results are better than the Interactive Modeling node.
Actions on Nodes in the Pipeline
Right-click any node in a pipeline to open a menu of actions.
- Select Run to
run the node. Any preceding nodes in the pipeline that do not have
a status of
Successfulare run first. After the preceding nodes complete successfully, the selected node runs. - Select Rename to
rename a node. The new name applies only to the node on this pipeline.
If you rename a modeling node that is connected to an Ensemble node, the Ensemble node becomes out-of-date. The Ensemble node and the rest of the pipeline need to be run again.
- Select Copy node link to obtain a link to send to other users who have access to the project. When the users open the link and sign in, they are directed to the pipeline with the node already selected. This action is not available for any node in a pipeline that is nested in a segmented pipeline.
- Select Log to view a log of the node’s processing. This option is enabled after running the node.
Data Node Actions
Right-click the Data node to open these actions in the menu.
- Select Add child node to add a forecasting modeling node to the pipeline. You cannot add child nodes in the External Segmentation or Demand Classification pipelines.
- Select Paste to
paste a modeling node from your clipboard into the pipeline.
Note: This option is not available in an External Forecast project.
- After the Data node has completed a run, select Time series viewer to open a plot of the historical data. See Viewers for Time Series in Your Project for more information.
Modeling Node Actions
Right-click any modeling node to get these actions in the menu.
- Add child node
-
Adds an Interactive Modeling node or Ensemble node after the modeling node. These options are in the Postprocessing sub menu. You can also add a Save Data node from the Miscellaneous sub menu.
- Delete
-
Removes the node from the pipeline. If it is the only modeling node in the pipeline, then the Model Comparison and Output nodes are also removed.
Note: You cannot delete nodes from the External Segmentation or Demand Classification pipelines. - Copy
-
Adds the modeling node to your clipboard. You can then paste the modeling node to any pipeline in your project. Any changes that you have made to the modeling node are also included when you paste the modeling node.
- Paste
-
Pastes an Interactive Modeling node, Ensemble node, or Save Data node that you have copied into your clipboard.
- Forecast viewer
-
Opens the Forecast Viewer, which provides a plot of the time seriesan aggregation of transactional data into specified time intervals and sorted according to unique combinations of the default attributes (BY variables), including historical and forecasta numerical prediction of a future value for a specified time period for each unique combination of BY variable values data for the project. For more information, see Opening the Time Series and Forecast Viewers.
- Open
-
Opens the code editor for the node. This option is available only for pluggable modeling nodes.
Note: The Open action is different on nodes in a segmented pipeline. See Customizing Each Segment for more information. - Modify Event Usage
-
Changes the settings for eventsan incident that disrupts the normal flow of any process that generates the time series. Examples of events are holidays, retail promotions, and natural disasters. for the node in this pipeline. See Changing Event Usage in Modeling Nodes for more information.
- Save as
-
Saves the node, with any settings you have made in the pane on the right, to The Exchange. This makes the saved node available for other projects.
- Results
-
Opens the results of the modeling node, including an execution summary, MAPE distribution, and other relevant data. For more information, see Viewing the Results for a Modeling Node.
- Create PDF report
-
Downloads a PDF of the results for a modeling node after it has completed successfully. For more information, see Generating Output from SAS Model Studio in SAS Visual Forecasting: Overview.
- View code
-
After the modeling node has run, this action opens a read-only view of the code for the modeling node .
Segmentation Nodes
For segmented pipelines, you have these nodes to work with.
- Profile Nodes
-
- External Segmentation Profile
- Demand Classification Profile
- Modeling Nodes
-
- External Segmentation Modeling
- Demand Classification Modeling
- Merge Segments
-
Merges the results produced by the segments.
For more information about actions on these nodes, see Customizing Each Segment.
Interactive Modeling Node Actions
Right-click the Interactive Modeling node to get these actions in the menu.
- Select Add child node
 MiscellaneousSave Data to add the Save Data node.
 - Select Delete to remove the node. After the node is removed, the pipeline must be run again.
- Select Copy to add the node to
your clipboard. You can paste it after another modeling node in the same pipeline
or another
pipeline within the same project. Any changes you made to the settings in the right
pane are
saved when you paste the node in a pipeline. The following changes that are made
in the node
are not saved.
- Any custom models that have been created
- Any changes to the champion model
- Setting forecast values to zero or missing
- Any overrides that have been created and saved.
There is a limit of one Interactive Modeling node for each modeling node.
- Select Open to view the results and run analyses on the time series.
- Select Modify Event Usage to change the settings for events for the node in this pipeline. See Changing Event Usage in Modeling Nodes for more information.
- Select Save As to save the
node to The Exchange. Any changes you made to the settings in the right pane are saved.
Any
changes that you made in the node are not saved. The following changes are not
saved.
- Any custom models that have been created
- Any changes to the champion model
- Setting forecast values to zero or missing
See Also
Model Comparison Node Actions
Right-click the Model Comparison node to get these actions in the menu.
- Select Results to view the MAPE distribution and summary statistics for each modeling node along with the selected champion model in the pipeline.
- Select Select
champion model to choose a champion model other than
the one selected by the Model Comparison. If you choose a different
champion model, you need to rerun the Model Comparison and Output
nodes.
After you choose a champion model, you can select the Select champion model option again and select Reset to restore the champion to the modeling node that was originally selected.
- Select Create PDF report to download a PDF of the results from Model Comparison after it has completed successfully. For more information, see Generating Output from SAS Model Studio in SAS Visual Forecasting: Overview.
Actions on the Pipeline
Click on the pipeline tab to perform these actions.
- Run
-
Runs the entire pipeline.
- Stop
-
Stops a pipeline that is running.
- Duplicate
-
Creates a duplicate pipeline. The name is appended with a number. You can rename the duplicate after it is created.
The pipeline for a segment of a pipeline cannot be duplicated.
Note: If the pipeline includes any Interactive Modeling nodes, customizations that have been made in the node are not preserved in the Interactive Modeling nodes in the new pipeline. These customizations include the following.- Any custom models that have been created
- Any changes to the champion model
- Setting forecast values to zero or missing
Any changes you make to the settings in the Options pane are preserved in the duplicated pipeline.
- Rename
-
Renames the pipeline.
- Save to The Exchange
-
Saves the pipeline with the nodes and any settings applied to those nodes as a template to The Exchange. The new templates can be used in other projects.
For projects that are imported from SAS Forecast Studio, the primary pipeline contains the Hierarchical Forecasting (Migrated) node. This pipeline should not be saved to The Exchange as a template. If this template is added to a project, the Hierarchical Forecasting (Migrated) node fails. That node is project-specific and works only in the project where it is first created.
Note: If the pipeline includes any Interactive Modeling nodes, customizations that have been made in the node are not preserved in the template that is saved. These customizations include the following.- Any custom models that have been created
- Any changes to the champion model
- Setting forecast values to zero or missing
Any changes you make to the settings in the Options pane are preserved in the template.
- Delete
-
Deletes the pipeline from the project. At least one pipeline must exist in a project. If only one pipeline exists, this action is disabled.
- Show overview map
-
Places a map of the pipeline in the upper left corner of the canvas.
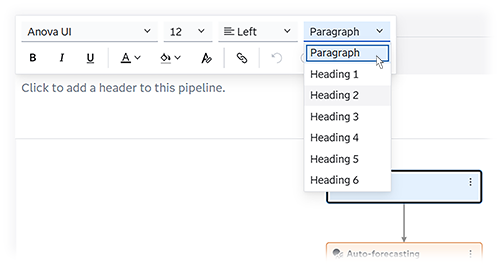
- Expand header
-
Provides a space at the top of the pipeline to add a header. Use the header to provide a description or other text that might be useful. A toolbar is provided for rich text editing so that you can format the text in the header.
- Copy graph to clipboard
-
Copies the pipeline image for pasting into rich text applications, such as a word processor or email. The image does not paste directly into image editors. However, you can select it from the rich text application and then paste it into the image editor.
- Copy pipeline link
-
Copies the link to a pipeline in your project to your clipboard. You can share the link with other users who have access to the project. When the users open the link and sign in, they are directed to the selected pipeline in the Pipeline tab.
Note: This action is not available for pipelines nested in a segmented pipeline or in Hierarchical Modeling.
Nodes Pane
On the left side of the pipeline is the Nodes pane. This pane lists the modeling nodes that you can add to any pipeline.
If the Nodes pane
is not displayed, click  on the left side of the pipeline to open it. You
can collapse the pane again by clicking
on the left side of the pipeline to open it. You
can collapse the pane again by clicking  .
.
You can drag a modeling node over the Data node in the pipeline to add it. To remove a node, right-click the node and select Delete. Each pipeline requires at least one modeling node.
Options Pane
The Options pane on the right side of the pipeline displays options that you can set for a selected node in the pipeline.
If the Options pane
is not displayed, click  to open it. You can collapse the pane again by clicking
  .
.
- All nodes in the pipeline have a Description option that you can update. Any description you provide is saved for the node only in the pipeline. The description for the node template in The Exchange is not affected by any updates that you make in the pipeline.
- Pluggable models in SAS Visual Forecasting that are nodes have an Open button that you can use to view and edit the code inline.
After running a pipeline,
any subsequent changes to the options for a modeling node move the
pipeline back to Out-of-date state.
This is also true if you make a change and then change the setting
back to the original value.
When a pipeline is running, the options for each modeling node in the pipeline cannot be changed until the pipeline completes. If you need to make further updates to a modeling node after starting the pipeline, click Stop pipeline and wait for the pipeline to stop operation before you make any changes.