Selecting a Champion Pipeline
Before you work on any overrides for your forecasting project, you need to make sure that you are working with the best pipeline for your data. SAS Visual Forecasting selects the best fit model in each pipeline and in each segment of a pipeline. After each pipeline is run, the champion pipeline is selected based on the statistics of fit that you choose for the selection criteria. If necessary, you can change the selected champion pipeline.
Changes to the project or other settings force your pipelines and the selected champion pipeline to become out of date. Make sure all pipelines are up-to-date and the best fit model and pipeline is selected as champion before working with overrides.
Model Comparison
Each pipeline with a modeling node has a Model Comparison node. When this node has completed successfully, the Model Comparison node has a green check mark indicating a status of Successful. Right-click the node and select Results to view the output of the node. The results display a Summary and Output Data tab for the pipeline.
For segmented pipelines, the modeling nodes and Model Comparison are included in the nested pipelines for each segment.
Summary Tab
The following information is available on the
Summary tab for Model Comparison
Results. Click  at the top of each table or graph to download a CSV file for the data.
You can choose to download either the raw data or data formatted for your specific
locale.
at the top of each table or graph to download a CSV file for the data.
You can choose to download either the raw data or data formatted for your specific
locale.
- Model Comparison
-
- At the top of the
Summary tab is the Model Comparison table.
The columns are described below.
Champion - The champion modeling node is marked with
 . If you determine that another model should be selected
as champion, you can manually select the champion model for the pipeline.
To select a champion model, right-click the Model Comparison node in the
pipeline and select the model from the Select champion
model list. If you choose a different champion model, you
need to rerun the Model Comparison and Output nodes.
. If you determine that another model should be selected
as champion, you can manually select the champion model for the pipeline.
To select a champion model, right-click the Model Comparison node in the
pipeline and select the model from the Select champion
model list. If you choose a different champion model, you
need to rerun the Model Comparison and Output nodes.The following shows the Model Comparison results from a pipeline with four modeling nodes. Two of the modeling nodes are Hierarchical Forecasting. The user applied different transformations on the dependent variable for each node, and renamed them, to compare the results. WMAPE was chosen as the model selection criteria. In this case, the Seasonal Model was selected as champion, based on its performance.
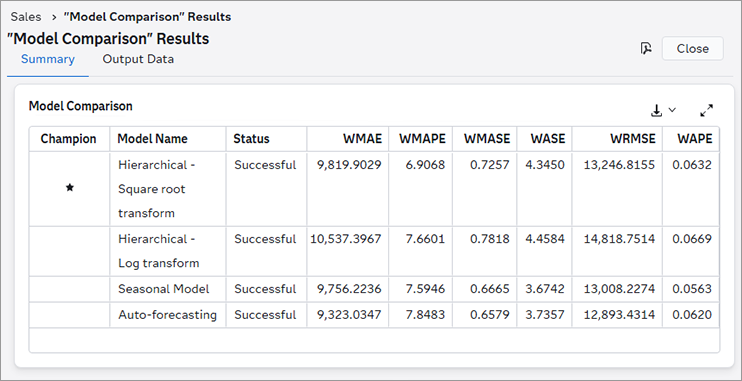
- Model Name - Each model in the pipeline or segment is listed.
- Status - Indicates the status of each modeling node in the pipeline or segment. If any models are out of date, rerun the pipeline before selecting the final champion pipeline and working with overrides.
- Weighted metrics - These
columns display the selection criteria that are available for comparing
different pipelines. Not all columns are shown. To view all of the
selection criteria, click
 .
Note: For projects using the External Forecast pipeline, if the values are missing from the ACTUAL column, the weighted metrics will have missing values in the Model Comparison results. See Working with External Forecast Projects for more information about the composition of external forecast projects.
.
Note: For projects using the External Forecast pipeline, if the values are missing from the ACTUAL column, the weighted metrics will have missing values in the Model Comparison results. See Working with External Forecast Projects for more information about the composition of external forecast projects.For a complete description, see Weighted Model Comparison Selection Criteria.
- At the top of the
Summary tab is the Model Comparison table.
The columns are described below.
- MAPE Distribution
-
For each node in the pipeline, this is a graph showing the MAPE distribution of results.
- Execution Summary
-
For each node in the pipeline, the following summary statistics are provided.
- Number of series
-
the total number of time seriesan aggregation of transactional data into specified time intervals and sorted according to unique combinations of the default attributes (BY variables) accumulated from the data. For a Hierarchical Forecasting modeling node, this corresponds to the number of time series in each level of the hierarchy.
- Number of failures
-
the number of time series where forecasts failed. For a Hierarchical Forecasting modeling node, this corresponds to the number of time series in each level of the hierarchy where forecasts failed.
- Number of forecasts equal to zero
-
the number of time series with at least one forecasta numerical prediction of a future value for a specified time period for each unique combination of BY variable values equal to 0. Retired time series are excluded from this measure.
- Number of intermittent series with flat forecasts
-
the number intermittent time series that have a constant forecast value over the length of the forecast horizonthe number of intervals into the future, beyond a base date, for which analyses and predictions are made. . Retired series and series with at least one zero forecast are excluded from this measure.
Forecasts for a time series are determined to be flat when the forecast range (maximum - minimum predicted value) is less than 0.00001.
- Number of seasonal series with flat forecasts
-
the number in seasonal time series that have a constant forecast value over the length of the forecast horizon. Retired series and series with at least one zero forecast are excluded from this measure.
Forecasts for a time series are determined to be flat when the forecast range (maximum - minimum predicted value) is less than 0.00001.
- Number of short series with flat forecasts
-
the number of short time series that have a constant forecast value over the length of the forecast horizon. Retired series and series with at least one zero forecast are excluded from this measure.
Forecasts for a time series are determined to be flat when the forecast range (maximum - minimum predicted value) is less than 0.00001.
- Number of all other series with flat forecasts
-
the number of all other time series that have a constant forecast value over the length of the forecast horizon. This number does not include short, intermittent, or seasonal time series with flat forecast values. Also, retired series and series with at least one zero forecast are excluded from this measure.
Forecasts for a time series are determined to be flat when the forecast range (maximum - minimum predicted value) is less than 0.00001.
- Number of retired series
-
the number of time series that have been identified as retired. See Retired for a full description of how time series are identified as retired.
- Number of forecasts below 70%
-
the number of time series with forecast values that are below the minimum range of the mean value for that time series. The forecasts for these series can be problematic. The minimum range value is set to 70% by default. If you change this setting using the Forecast exception boundaries in the Project Settings, this number reflects that change.
- Number of forecasts above 300%
-
the number of time series with forecast values that are above the maximum range of the mean value for that time series. The forecasts for these series can be problematic. The maximum range value is set to 300% by default. If you change this setting using the Forecast exception boundaries in the Project Settings, this number reflects that change.
See Also
-
Generating Output from SAS Model Studio in SAS Visual Forecasting: Overview
Output Data
The tables on this tab reflect the output generated by the champion modeling node for the pipeline. For a full description of these tables, see Output Data Sets.
Pipeline Comparison
The Pipeline Comparison tab shows the different pipelines for a project and selects a champion pipeline. The selected champion pipeline, along with the selected model in that pipeline, are used for the final forecasts for the project. When you create overrides for the forecasts, they are based on forecasts generated from the champion pipeline. You do not want to start creating overrides until you are confident that the best pipeline and model has been selected as champion.
If you determine for other reasons that another pipeline should be used as champion, follow these steps to select a different champion.
- Select the Pipeline Comparison tab.
- Select a pipeline from the list.
- Click
 over the right side of the table and select Set
as champion.
over the right side of the table and select Set
as champion.
The table is updated
to show the new champion pipeline, using  . When you go to the Overrides tab,
the page is updated with the forecasts from the new champion.
. When you go to the Overrides tab,
the page is updated with the forecasts from the new champion.
After manually selecting a champion pipeline, if you change the settings for any pipelines, the pipeline must be run again and the champion pipeline can be reassigned.
See Also
-
Generating Output from SAS Model Studio in SAS Visual Forecasting: Overview