Creating Filters
One or more default attributes must be assigned to the project before you can create filtersa set of specified criteria that are applied to data in order to identify the subset of data for a subsequent operation, such as continued processing. . See Assigning the Default Attributes for more information.
Use Filters on the left pane of the viewer to create and manage filters. The Default attributes are already displayed and ready for you to make your selections. If additional attributes are imported into the project, those attributes and the default attributes are listed under the name of the table that was used for the import.
- Click
 next to Attributes to add or remove
one of these derived attributes types from the pane:
next to Attributes to add or remove
one of these derived attributes types from the pane:
- Descriptive statistics
- Forecast
attributesNote: If an out-of-sample regionthe number of time periods before the end of the data that are removed when fitting models. After model selection, forecasts are generated in the out-of-sample region and then compared to the actual data to determine accuracy. is specified in Project Settings, then you can include these options for the attribute type:
- Forecast attributes (in-sample)
- Forecast attributes (out-of-sample)
- Forecast attributes
(Others)
This group includes two variables that are not computed along with the main forecasta numerical prediction of a future value for a specified time period for each unique combination of BY variable values attributes:
Flat ForecastandAlmost Flat Forecast. For more information, see Working with Flat Forecasts. - Model attributes
- Demand classification
attributesNote: For external forecast projects, demand classification attributes are listed on the Data tab. However, they are not available for the project in the Filters pane for the Time Series Viewer, Forecast Viewer, or Overrides.
Changing any of the Project Settings for this project can lead to errors.
Use the Filter Settings window to show, hide, or reorder the attribute types. These settings are saved for the duration of your session.
For a full description of attributes, see Attributes.
- Use next to each attribute type to show, hide, or reorder
the attributes that are listed.
- Select values from the attributes in the list to create a subset of the data to work
with. You can select multiple values from any set of attributes, using any combination
of values. The plot in the view is updated to reflect the selections that you make.
If no time seriesan aggregation of transactional data into specified time intervals and sorted according
to unique combinations of the default attributes (BY variables) exists in the set of attributes that you have selected for a filter, then no data is shown.
Making selections from the attributes depends on whether the attribute values are discrete or continuous.
- Selecting from attributes with discrete values
-
You can make selections from attributes with discrete values using check boxes. If the attribute contains more than five values, click the More link to open a window with all of the values.
For example, perhaps you want to filter the project to select only items where the Product Name attribute includes the string Shampoo. Under the Product Name attribute, click More and enter the search string to list all products with Shampoo in the name. You do not need to enter the full word to get matching results
To select all of the results in the search request, be sure to manually select each item shown. Do not use the Select all field because this selects all values for the attribute.
The plot is updated to reflect the selected products that contain the string Shampoo.
- Selecting from attributes with a continuous range of values
-
Use the slider to select from numeric data within a range of values.
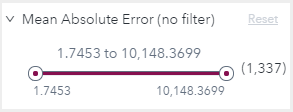
- The following image
shows the slider for a numeric range for one of the statistics of
fit attribute, Mean Absolute Error (MAE). This is a derived attribute
that is available on the Forecast Viewer and Overrides tab. In this figure, the numeric range of MAE measurements for all of the time series ranges between 1.7453 to 10,148.3699. A total number of 1,337 time series are included
in this range.
To set the slide control to a specific number, follow these steps.
- The following image
shows the slider for a numeric range for one of the statistics of
fit attribute, Mean Absolute Error (MAE). This is a derived attribute
that is available on the Forecast Viewer and Overrides tab. In this figure, the numeric range of MAE measurements for all of the time series ranges between 1.7453 to 10,148.3699. A total number of 1,337 time series are included
in this range.
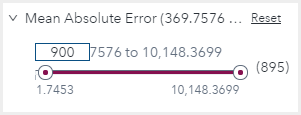
- Click the end of the
slider control on one side of the range.
- For a simple numeric
value, an entry field appears over the value and you can enter a number
to use for the range. In the following figure, the number 900 is entered
at the low end of the range.
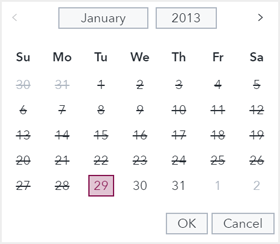
- If the attribute has
date values,
 appears instead of an entry field. Click the icon to open the date picker. The date
picker enables you to select starting and ending dates that are only within the range
of the filter.
appears instead of an entry field. Click the icon to open the date picker. The date
picker enables you to select starting and ending dates that are only within the range
of the filter.
- For a simple numeric
value, an entry field appears over the value and you can enter a number
to use for the range. In the following figure, the number 900 is entered
at the low end of the range.
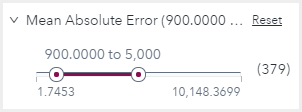
- Repeat this step for the other side of the range. Using the entry fields, you can
enter a precise number for the lower and upper limits of the range that you want to
filter.
In the following figure, the range has been set to 900 to 5,000 for the MAE attribute. This changes the number of time series selected from 1,337 to 379.
- After creating a filter that you can use, click
 and provide a name for the new filter.
The filter is saved and can be recalled using the drop-down list of saved filters.
As you make selections from the Filters pane, a token is displayed above the plot for your selection.
- For attributes with
discrete values, multiple selections can be chosen. If a single value
is chosen for an attribute, the token displays the value. In this
example, the DIAG1_ARIMAX1 value is selected
from the Model attribute of the Forecast
attributes type:
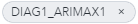
To locate the attribute that the filter belongs to, hold your pointer over the token. The tooltip shows the attribute type and attribute for the selected value.
If multiple selections are chosen, the token displays the attribute type and the attribute name. In this example, the DIAG1_ARIMAX1 and DIAG1_ESM1 values are selected from the Model attribute of the Forecast attributes type:
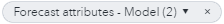
Click the down arrow to view the list of selections. You can also remove individual selections from the drop-down list, as well as remove the selections in the Filters pane.
- For attributes with
a continuous range of values, a single range can be specified for
the attribute. The token for the selected range shows the attribute
with the range selected. In this example, a range of 10 to 200 is
selected from the Mean Absolute Percent Error attribute
of the Forecast attributes type.
