Ensemble Node
The Ensemble node evaluates the forecasts from the parent (predecessor) modeling nodes that are connected to it and selects the forecasta numerical prediction of a future value for a specified time period for each unique combination of BY variable values for each time seriesan aggregation of transactional data into specified time intervals and sorted according to unique combinations of the default attributes (BY variables) based on the fit statistics selected by the user. You select a single metric (fit statistic) for the Ensemble node to use when selecting the forecast for each time series.
If the user specifies an out-of-sample regionthe number of time periods before the end of the data that are removed when fitting models. After model selection, forecasts are generated in the out-of-sample region and then compared to the actual data to determine accuracy. in Project Settings, the Ensemble node uses the out-of-sample statistics (Forecast region) for its criterion. Otherwise, it uses in-sample statistics.
The Ensemble node is a postprocessing node. You
can add this node to the pipeline by dragging it from the left pane and placing it
over a
modeling node. You can also add it by right-clicking a modeling node and selecting
Add child node![]() Postprocesing
Postprocesing![]() Ensemble. For every modeling node that the Ensemble node is connected to, there is
also a direct connection from the modeling node to Model Comparison, as shown in Ensemble Node in Pipeline with Three Modeling Nodes .
Ensemble. For every modeling node that the Ensemble node is connected to, there is
also a direct connection from the modeling node to Model Comparison, as shown in Ensemble Node in Pipeline with Three Modeling Nodes .
After adding the Ensemble node to the pipeline, you can connect more modeling nodes by right-clicking the Ensemble node and selecting Select Models. Select any model that you want to add. Deselect any modeling node that you want to remove.
Connecting the Ensemble node to only one modeling node defeats the purpose of selecting the best forecast for each time series as champion, since there would only be one modeling node to choose from.
Results from the Ensemble node can be inconsistent. In a set of modeling nodes connected to an Ensemble node, some of the modeling nodes might score equally for the selected fit statistic. In this case, the model selected for a time series as the champion can be arbitrary. This situation can be observed when comparing the results from two Ensembles nodes in different pipelines that are connected to the same set of modeling nodes, using the same settings.
The following illustration shows how the Ensemble node can be placed in a pipeline. It shows three modeling nodes: Auto-forecasting, Hierarchical Forecasting, and Regression for Time Series. Two ensemble nodes have been added to the pipeline. One of them is named Ensemble (1). The (1) is added by default to distinguish it from the other Ensemble node. Like any node in the pipeline, they can be renamed.
Ensemble Node in Pipeline with Three Modeling Nodes
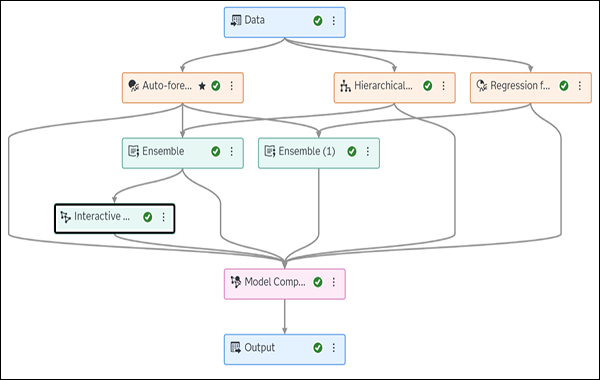
The node named Ensemble is connected to Auto-forecasting and Hierarchical Forecasting. The node named Ensemble (1) is connected to Auto-forecasting and Regression for Time Series. Both Ensemble nodes select the best forecast for each time series from the two preceding modeling nodes. There is an Interactive Modeling node placed after the Ensemble node. You cannot add an Interactive Modeling node before an Ensemble node. You can add an Interactive Modeling node between one of the modeling nodes and Model Comparison. The Save Data node can also be added as a child of the Ensemble node.
The following options are available in the Options pane on the right after this node has been selected.
- Metric
-
Select from the list of fit statistics. The metric that you specify is used to select the best forecast for each time series in the Ensemble node.
- Output Tables
-
The following output tables are required and preselected. To save any of these tables to the caslib of your choice, connect a Save Data node to the Ensemble node.