Weights of Constituent Nodes (OUTWEIGHT)
This table is produced by the Interactive Modeling node and the Ensemble node. If either of these nodes is the pipeline champion, then this table is available in the Model Comparison results. The following illustration shows this table in the Model Comparison results.
OUTWEIGHT Table in the Model Comparison Results
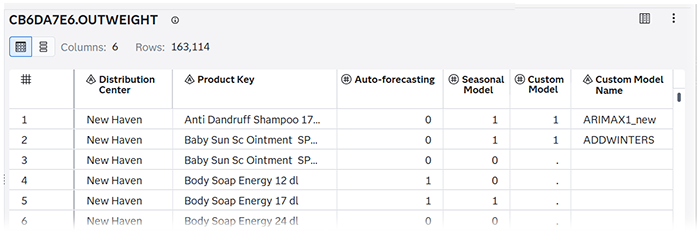
The first two columns show the labels for the BY variables in this project. The next two columns show the labels for the predecessor modeling nodes. The last two columns are always shown. If a custom model is a champion, it is listed with a 1 in the Custom Model column. If not, it is not listed and the Custom Model contains a missing value. The number of columns you have depends on the number of BY variables and predecessor models.
If you generate the OUTWEIGHT table using the Save Data node, it shows the complete schema in SAS Data Explorer. The following figure shows that the schema for this table includes the Name, Label, Data Type, Raw Length, Formatted Length, and Format.
OUTWEIGHT Table in SAS Data Explorer
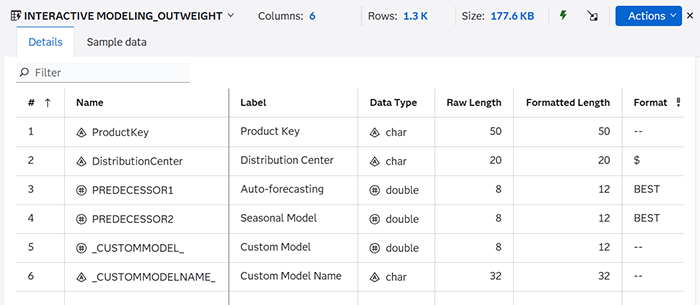
The Label is the only column listed in the results for Model Comparison.
The predecessor modeling nodes are listed
in the Name column as
PREDECESSORn, where
n is the number assigned to the
predecessor. The modeling node name is shown in the
Label column.