Forecast Plot Extends Past the Horizon with Zero Forecasts
Description
The forecasta numerical prediction of a future value for a specified time period for each unique combination of BY variable values plots in the Forecast Viewer, Overrides tab, or Interactive Modeling can show a plot that extends past the length of the horizonthe number of intervals into the future, beyond a base date, for which analyses and predictions are made. with zero forecasts.
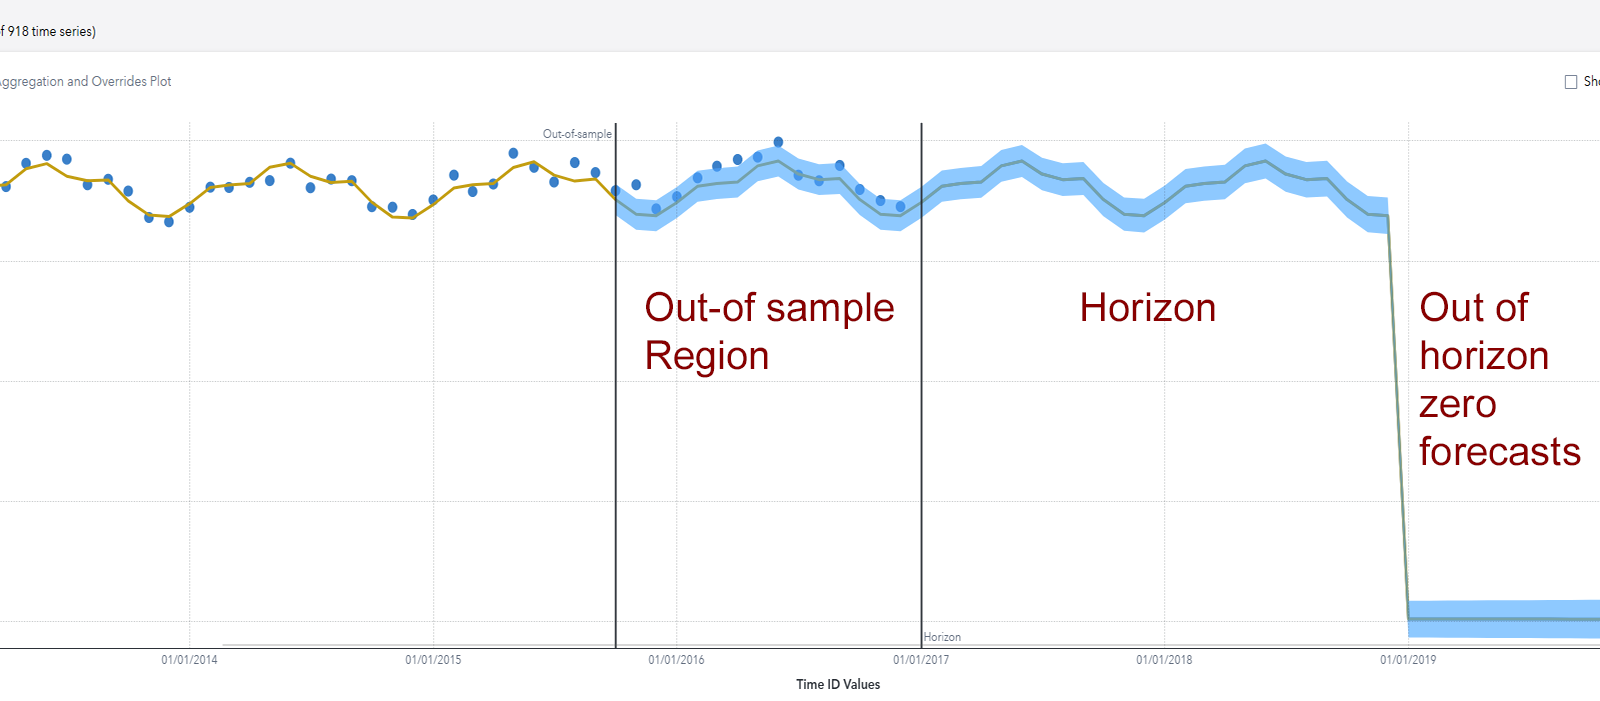
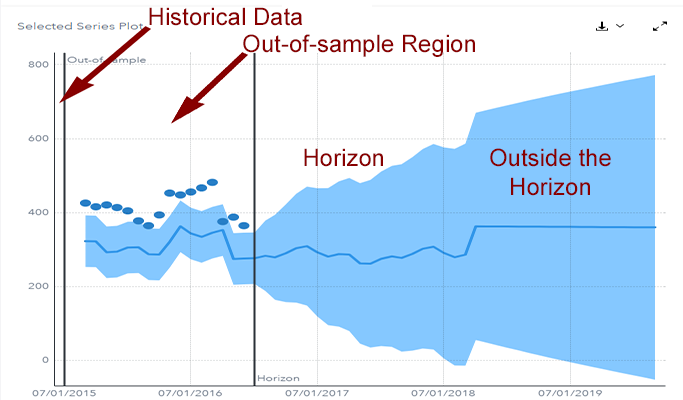
This can occur when the out-of-sample regionthe number of time periods before the end of the data that are removed when fitting models. After model selection, forecasts are generated in the out-of-sample region and then compared to the actual data to determine accuracy. is so large that all of the data from some of the time seriesan aggregation of transactional data into specified time intervals and sorted according to unique combinations of the default attributes (BY variables) fall within the out-of-sample region. The out-of-sample region is reset to zero for such time series, but it remains unchanged for other time series. The following figure shows the plot for a single time series that is selected showing all of its data within the out-of-sample region.
The OUTLOG for the model should show this error message:
WARNING: After accumulation there
                  is insufficient data for BACK=25. The BACK= option will be reset to
                  zero.
In this message,
BACK=25 refers to the size of the out-of-sample region.
Solution
Reduce the size of the out-of-sample region in Project Settings.