VARMAX Procedure
Impulse Response Function
Simple Impulse Response Function (IMPULSE=SIMPLE Option)
The VARMAX(p,q,s) model has a convergent representation

where  and
and  .
.
The elements of the matrices  from the operator
  , called the impulse response, can be interpreted as the response of a variable to a shock in another variable. Let
  be the (i, n) element of
  at lag j, where n is the index for the impulse variable, and i is the index for the response variable (impulse
  response); that is to say, shows the reaction of the i-th variable to a unit shock in variable n, j periods ago, assuming that the effect is not contaminated by other shocks (Lütkepohl 1993). For instance,
  is an impulse response to
  , and
, and  is an impulse response to
  .
.
Accumulated Impulse Response Function (IMPULSE=ACCUM Option)
The accumulated impulse response function is the cumulative sum of the impulse response function,  .
.
Orthogonalized Impulse Response Function (IMPULSE=ORTH Option)
The MA representation of a VARMA(p,q) model with a standardized white noise innovation process offers another way to interpret a VARMA(p,q) model. Since  is positive-definite, there is a lower triangular matrix P such that
  . The alternate MA representation of a VARMA(p,q) model is written as

where  ,
,  , and
, and  .
.
The elements of the matrices  , called the orthogonal impulse response, can be interpreted as the effects of the components of the standardized shock process
  on the process
  at lag j.
Impulse Response of Transfer Function (IMPULSX=SIMPLE Option)
The coefficient matrix  from the transfer function operator
  can be interpreted as the effects that changes in the exogenous variables
  have on the output variable
  at lag j; it is called an impulse response matrix in the transfer function.
Accumulated Impulse Response of Transfer Function (IMPULSX=ACCUM Option)
The accumulated impulse response in the transfer function is the cumulative sum of the impulse response in the transfer function,  .
.
The asymptotic distributions of the impulse functions can be seen in the section VAR and VARX Modeling.
The following statements provide the impulse response and the accumulated impulse response in the transfer function for a VARX(1,0) model:
proc varmax data=grunfeld plot=impulse;
   model y1-y3 = x1 x2 / p=1 lagmax=5
                         printform=univariate
                         print=(impulsx=(all) estimates);
run;
In Figure 45, the variables  and
and  are impulses, and the variables
  ,
,  , and
, and  are responses. The keyword STD stands for the standard errors of the elements. You can read the table that matches the
  pairs, such as
  ,
,  ,
,  ,
,  ,
,  , and
, and  . In the pair , you can see the long-run responses of to an impulse in (the values are 1.69281, 0.35399, 0.09090, and so on for lag 0, lag 1, lag 2, and so on, respectively).
Figure 45: Impulse Response in Transfer Function (IMPULSX= Option)
| Simple Impulse Response of Transfer Function by Variable | |||
|---|---|---|---|
| Variable Response\Impulse |
Lag | x1 | x2 |
| y1 | 0 | 1.69281 | -0.00859 |
| STD | 0.54395 | 0.05361 | |
| 1 | 0.35399 | 0.01727 | |
| STD | 0.36482 | 0.03762 | |
| 2 | 0.09090 | 0.00714 | |
| STD | 0.17419 | 0.01592 | |
| 3 | 0.05136 | 0.00214 | |
| STD | 0.08203 | 0.00524 | |
| 4 | 0.04717 | 0.00072 | |
| STD | 0.07969 | 0.00229 | |
| 5 | 0.04620 | 0.00040 | |
| STD | 0.08216 | 0.00170 | |
| y2 | 0 | -6.09850 | 2.57980 |
| STD | 5.07849 | 0.50056 | |
| 1 | -5.15484 | 0.45445 | |
| STD | 3.89665 | 0.40534 | |
| 2 | -3.04168 | 0.04391 | |
| STD | 1.56519 | 0.13268 | |
| 3 | -2.23797 | -0.01376 | |
| STD | 1.15163 | 0.08723 | |
| 4 | -1.98183 | -0.01647 | |
| STD | 1.08738 | 0.07844 | |
| 5 | -1.87415 | -0.01453 | |
| STD | 0.99384 | 0.07250 | |
| y3 | 0 | -0.02317 | -0.01274 |
| STD | 0.20418 | 0.02012 | |
| 1 | 1.57476 | -0.01435 | |
| STD | 0.56132 | 0.05515 | |
| 2 | 1.80231 | 0.00398 | |
| STD | 0.61049 | 0.05896 | |
| 3 | 1.77024 | 0.01062 | |
| STD | 0.64476 | 0.06380 | |
| 4 | 1.70435 | 0.01197 | |
| STD | 0.62648 | 0.06353 | |
| 5 | 1.63913 | 0.01187 | |
| STD | 0.59511 | 0.06142 | |
Figure 46 shows the responses of , , and to a forecast error impulse in .
Figure 46: Plot of Impulse Response in Transfer Function
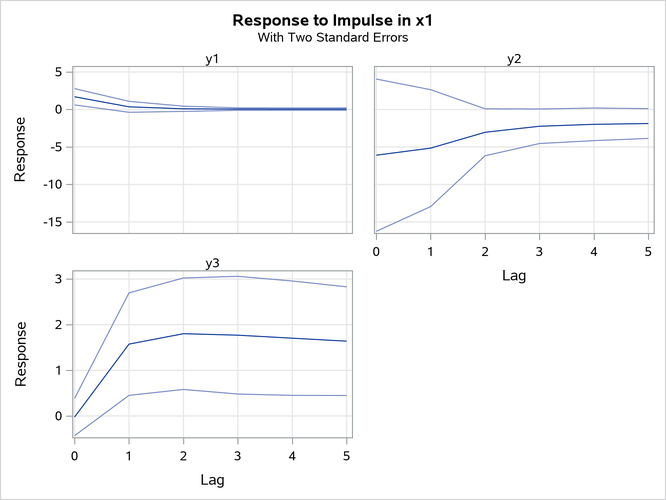
Figure 47 shows the accumulated impulse response in transfer function.
Figure 47: Accumulated Impulse Response in Transfer Function (IMPULSX= Option)
| Accumulated Impulse Response of Transfer Function by Variable | |||
|---|---|---|---|
| Variable Response\Impulse |
Lag | x1 | x2 |
| y1 | 0 | 1.69281 | -0.00859 |
| STD | 0.54395 | 0.05361 | |
| 1 | 2.04680 | 0.00868 | |
| STD | 0.36482 | 0.03762 | |
| 2 | 2.13770 | 0.01582 | |
| STD | 0.17419 | 0.01592 | |
| 3 | 2.18906 | 0.01796 | |
| STD | 0.08203 | 0.00524 | |
| 4 | 2.23623 | 0.01867 | |
| STD | 0.07969 | 0.00229 | |
| 5 | 2.28243 | 0.01907 | |
| STD | 0.08216 | 0.00170 | |
| y2 | 0 | -6.09850 | 2.57980 |
| STD | 5.07849 | 0.50056 | |
| 1 | -11.25334 | 3.03425 | |
| STD | 3.89665 | 0.40534 | |
| 2 | -14.29502 | 3.07816 | |
| STD | 1.56519 | 0.13268 | |
| 3 | -16.53299 | 3.06440 | |
| STD | 1.15163 | 0.08723 | |
| 4 | -18.51482 | 3.04793 | |
| STD | 1.08738 | 0.07844 | |
| 5 | -20.38897 | 3.03340 | |
| STD | 0.99384 | 0.07250 | |
| y3 | 0 | -0.02317 | -0.01274 |
| STD | 0.20418 | 0.02012 | |
| 1 | 1.55159 | -0.02709 | |
| STD | 0.56132 | 0.05515 | |
| 2 | 3.35390 | -0.02311 | |
| STD | 0.61049 | 0.05896 | |
| 3 | 5.12414 | -0.01249 | |
| STD | 0.64476 | 0.06380 | |
| 4 | 6.82848 | -0.00052 | |
| STD | 0.62648 | 0.06353 | |
| 5 | 8.46762 | 0.01135 | |
| STD | 0.59511 | 0.06142 | |
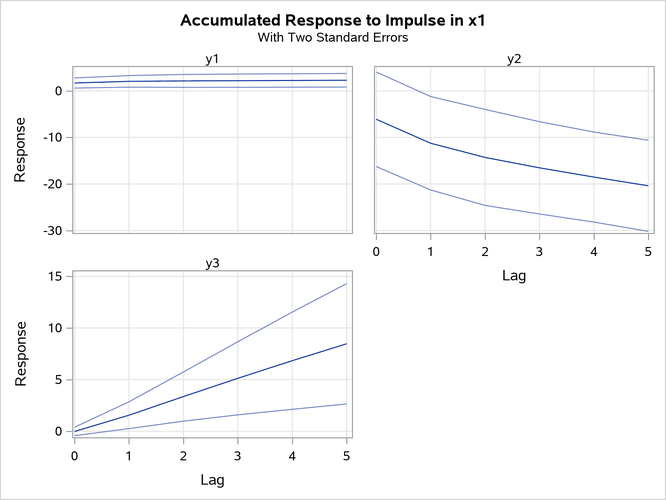
Figure 48 shows the accumulated responses of , , and to a forecast error impulse in .
Figure 48: Plot of Accumulated Impulse Response in Transfer Function
The following statements provide the impulse response function, the accumulated impulse response function, and the orthogonalized impulse response function with their standard errors for a VAR(1) model. Parts of the VARMAX procedure output are shown in Figure 49, Figure 51, and Figure 53.
proc varmax data=simul1 plot=impulse;
   model y1 y2 / p=1 noint lagmax=5
                 print=(impulse=(all))
                 printform=univariate;
run;
Figure 49 is the output in a univariate format associated with the PRINT=(IMPULSE=) option for the impulse response function. The keyword STD stands for the standard errors of the elements. The matrix in terms of the lag 0 does not print since it is the identity. In Figure 49, the variables and of the first row are impulses, and the variables and of the first column are responses. You can read the table matching the pairs, such as  ,
,  ,
,  , and
, and  . For example, in the pair of at lag 3, the response is 0.8055. This represents the impact on y1 of one-unit change in after 3 periods. As the lag gets higher, you can see the long-run responses of to an impulse in itself.
Figure 49: Impulse Response Function (IMPULSE= Option)
| Simple Impulse Response by Variable | |||
|---|---|---|---|
| Variable Response\Impulse |
Lag | y1 | y2 |
| y1 | 1 | 1.15977 | -0.51058 |
| STD | 0.05508 | 0.05898 | |
| 2 | 1.06612 | -0.78872 | |
| STD | 0.10450 | 0.10702 | |
| 3 | 0.80555 | -0.84798 | |
| STD | 0.14522 | 0.14121 | |
| 4 | 0.47097 | -0.73776 | |
| STD | 0.17191 | 0.15864 | |
| 5 | 0.14315 | -0.52450 | |
| STD | 0.18214 | 0.16115 | |
| y2 | 1 | 0.54634 | 0.38499 |
| STD | 0.05779 | 0.06188 | |
| 2 | 0.84396 | -0.13073 | |
| STD | 0.08481 | 0.08556 | |
| 3 | 0.90738 | -0.48124 | |
| STD | 0.10307 | 0.09865 | |
| 4 | 0.78943 | -0.64856 | |
| STD | 0.12318 | 0.11661 | |
| 5 | 0.56123 | -0.65275 | |
| STD | 0.14236 | 0.13482 | |
Figure 50 shows the responses of and to a forecast error impulse in with two standard errors.
Figure 50: Plot of Impulse Response
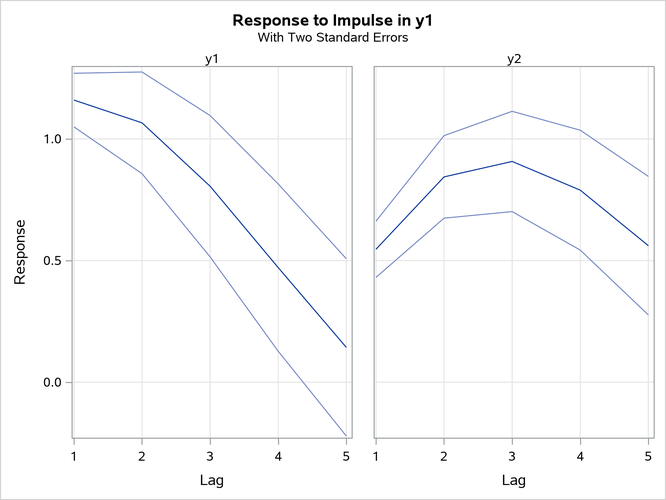
Figure 51 is the output in a univariate format associated with the PRINT=(IMPULSE=) option for the accumulated impulse response function. The matrix in terms of the lag 0 does not print since it is the identity.
Figure 51: Accumulated Impulse Response Function (IMPULSE= Option)
| Accumulated Impulse Response by Variable | |||
|---|---|---|---|
| Variable Response\Impulse |
Lag | y1 | y2 |
| y1 | 1 | 2.15977 | -0.51058 |
| STD | 0.05508 | 0.05898 | |
| 2 | 3.22589 | -1.29929 | |
| STD | 0.21684 | 0.22776 | |
| 3 | 4.03144 | -2.14728 | |
| STD | 0.52217 | 0.53649 | |
| 4 | 4.50241 | -2.88504 | |
| STD | 0.96922 | 0.97088 | |
| 5 | 4.64556 | -3.40953 | |
| STD | 1.51137 | 1.47122 | |
| y2 | 1 | 0.54634 | 1.38499 |
| STD | 0.05779 | 0.06188 | |
| 2 | 1.39030 | 1.25426 | |
| STD | 0.17614 | 0.18392 | |
| 3 | 2.29768 | 0.77302 | |
| STD | 0.36166 | 0.36874 | |
| 4 | 3.08711 | 0.12447 | |
| STD | 0.65129 | 0.65333 | |
| 5 | 3.64834 | -0.52829 | |
| STD | 1.07510 | 1.06309 | |
Figure 52 shows the accumulated responses of and to a forecast error impulse in with two standard errors.
Figure 52: Plot of Accumulated Impulse Response
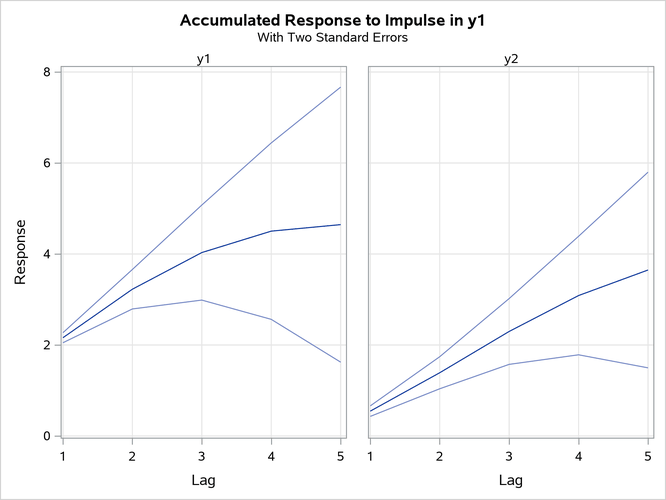
Figure 53 is the output in a univariate format associated with the PRINT=(IMPULSE=) option for the orthogonalized impulse response function. The two right-hand side columns, and , represent the  and
and  variables. These are the impulses variables. The left-hand side column contains responses variables, and . You can read the table by matching the pairs such as
  ,
,  ,
,  , and
, and  .
.
Figure 53: Orthogonalized Impulse Response Function (IMPULSE= Option)
| Orthogonalized Impulse Response by Variable | |||
|---|---|---|---|
| Variable Response\Impulse |
Lag | y1 | y2 |
| y1 | 0 | 1.13523 | 0.00000 |
| STD | 0.08068 | 0.00000 | |
| 1 | 1.13783 | -0.58120 | |
| STD | 0.10666 | 0.14110 | |
| 2 | 0.93412 | -0.89782 | |
| STD | 0.13113 | 0.16776 | |
| 3 | 0.61756 | -0.96528 | |
| STD | 0.15348 | 0.18595 | |
| 4 | 0.27633 | -0.83981 | |
| STD | 0.16940 | 0.19230 | |
| 5 | -0.02115 | -0.59705 | |
| STD | 0.17432 | 0.18830 | |
| y2 | 0 | 0.35016 | 1.13832 |
| STD | 0.11676 | 0.08855 | |
| 1 | 0.75503 | 0.43824 | |
| STD | 0.06949 | 0.10937 | |
| 2 | 0.91231 | -0.14881 | |
| STD | 0.10553 | 0.13565 | |
| 3 | 0.86158 | -0.54780 | |
| STD | 0.12266 | 0.14825 | |
| 4 | 0.66909 | -0.73827 | |
| STD | 0.13305 | 0.15846 | |
| 5 | 0.40856 | -0.74304 | |
| STD | 0.14189 | 0.16765 | |
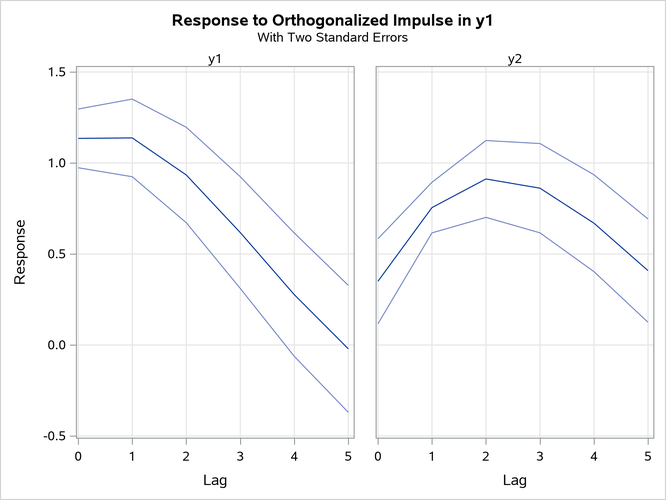
In Figure 4, there is a positive correlation between  and
and  . Therefore, shock in can be accompanied by a shock in in the same period. For example, in the pair of , you can see the long-run responses of to an impulse in .
Figure 54 shows the orthogonalized responses of and to a forecast error impulse in with two standard errors.
Figure 54: Plot of Orthogonalized Impulse Response