Time Series Selector
The Series pane displays the list of time seriesan aggregation of transactional data into specified time intervals and sorted according to unique combinations of the default attributes (BY variables) from the selected filtera set of specified criteria that are applied to data in order to identify the subset of data for a subsequent operation, such as continued processing. . When the viewer is first opened, all time series for the project are shown. With each selection that you make in the list, the time plot for the selection is shown in the right pane. The time series descriptor, using the BY group values that define the time series, is added to the legend for the plot, along with a color key for each time plot.
For legibility reasons, you can select only up to a maximum of 16 time series.
In the Forecast Viewer and Time Series viewer, you can multi-select or remove selected time series by holding down the Ctrl key and clicking each selection.
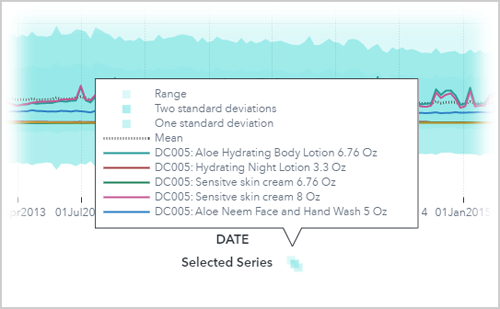
After a large number of time series is selected, the listing legend might collapse as it runs out of space to display all of your selections. To view the entire list of selected time series in the legend, click the collapsed icon next to Selected Series under the plot.
For more information about any time series listed in the Series pane, follow these instructions.
- Right-click the time series, or select the series and click
 .
. - Select one of these options:
- Select Properties to view the descriptive statistics for the selected time series.
- Select Statistics of Fit to view model selection criteria for the selected time series.
Note: For hierarchical forecasting, the statistics of fit value shown here differs from the one shown in the Modeling tab for the champion model. This measure is the reconciled value from the OUTSTAT table . The measure in the Modeling tab is the value before reconciliation from the OUTSELECT table .