SASENOAA Interface Engine
Example 50.8 Retrieving Tornado Vortex Signature Data by Using Tile Coordinates
(View the complete code for this example.)
This example retrieves the tornado vortex signature (TVS) data for the range May 5 to May 16, 2006, but it selects only the data that fall inside the geographic area defined by the specified tile’s longitude and latitude coordinates (to the nearest tenth of a degree). Output 50.8.1 shows five observations within range of the coordinates specified in the TILE= option.
options validvarname=any;

title 'Retrieve NOAA NX3TVS Using TILE= Option with a Date Range';
libname mylib "/sasusr/noaa/doc/";
libname noaa sasenoaa "%sysget(NOAA_DATA)"
   noaaset=nx3tvs
   range='20060505:20060516'
   tile='-102.12,32.62'
   outXml=my2TL
   automap=replace
   mapref=MyMap
   xmlmap="%sysget(NOAA_DATA)my2TL.map"
   format=xml
   ;

data mylib.TVStil;
   set noaa.my2TL;
run;
proc contents data=mylib.TVStil; run;
proc print data=mylib.TVStil; run;
Output 50.8.1: Using the TILE= Option to Retrieve TVS Data for a Date Range
| Retrieve NOAA NX3TVS Using TILE= Option with a Date Range |
| Obs | ztime | wsr_id | cell_id | cell_type | range | azimuth | max_shear | mxdv | shape |
|---|---|---|---|---|---|---|---|---|---|
| 1 | 2006-05-06T00:41:29 | KMAF | D9 | TVS | 37 | 6 | 39 | 85 | POINT (-102.112726356403 32.5574494581267) |
| 2 | 2006-05-06T03:56:18 | KMAF | N4 | TVS | 39 | 3 | 30 | 73 | POINT (-102.14873079873 32.5933553250156) |
| 3 | 2006-05-06T03:56:18 | KMAF | N4 | TVS | 42 | 4 | 20 | 52 | POINT (-102.131167022161 32.6426287452898) |
| 4 | 2006-05-06T04:00:30 | KMAF | N4 | TVS | 38 | 5 | 35 | 86 | POINT (-102.123671677514 32.5751241756203) |
| 5 | 2006-05-06T04:04:44 | KMAF | N4 | TVS | 41 | 8 | 24 | 62 | POINT (-102.076389686189 32.6209390786829) |
Note: You could add the option STAT='COUNTGROUPBY:WSR_ID', and the statistics would be stored in a data set named My2TL_S. The statistics results data show all the reporting weather stations by WSR_ID for the specified date range and the summary count of TVS features recorded for each station.
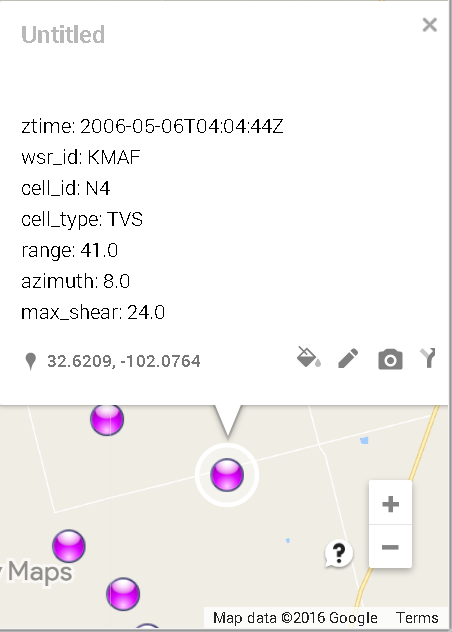
If you want to see a Google map of the same tile’s NX3TVS data, you can rerun this example with the FORMAT=KMZ, KMZMAP=, and OUTKMZ= options to download the corresponding KML file. After you import it to Google My Maps, you see a map like the one shown in Figure 2. When you click on the rightmost data point, you can examine the details of that particular location on the map.
Figure 2: Screen Shot of Google Earth Map of the NX3TVS Data for TILE=-102.12,32.62